Inspire Your Sales Team by Integrating Microsoft Dynamics 365 with Power BI
Quick Introduction
You must make smart business decisions if you want to make more money and sell more. This needs to be done with the help of data-driven insights and the ability to share information between teams and peers. Most businesses get their data from more than one place, so they must combine and analyze it to get the necessary information. With Microsoft Power BI and Microsoft Dynamics 365 CRM integrated, you can give your sales teams analytics that is accurate and focused on results.
Integrating Microsoft Dynamics 365 Sales can help your sales teams at every stage, from finding prospects and leads to making approaches, giving presentations, and closing sales. D365 Sales can automate the whole sales process. So, if we quickly go through the process, if a lead is found that fits the criteria, the system lets you create an account, contacts, and opportunities. You can also keep track of the lead’s progress and the next steps and stages of lead conversion.
 Overview of Microsoft Dynamics 365 Sales Module
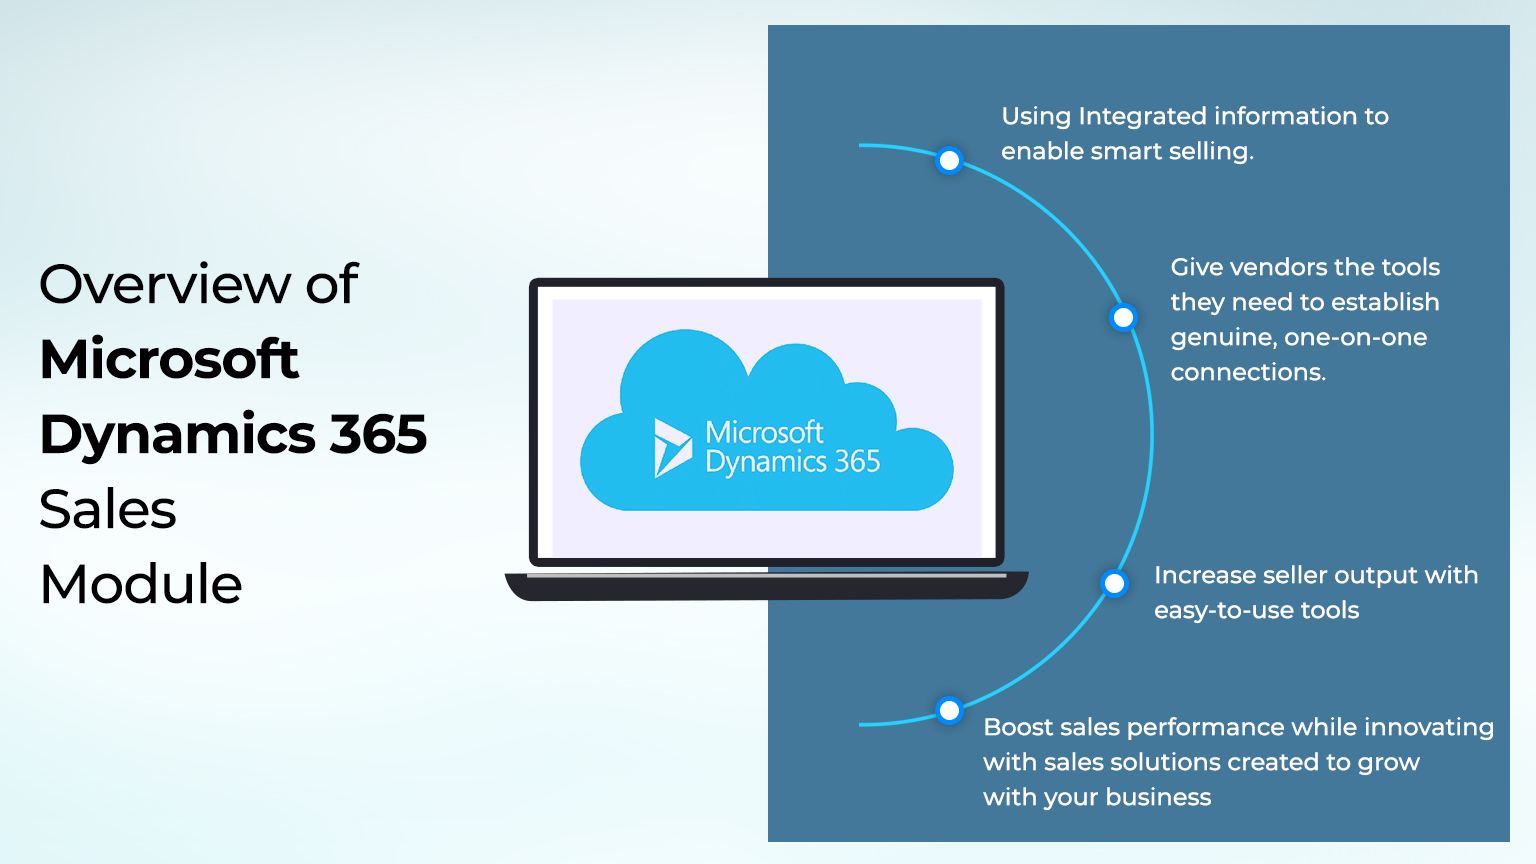
The Sales module is one of the most important parts of Dynamics 365 for any sales-based business. Using this module, you can make a sales process that is unique to your business. Dynamics 365 can be changed to fit the needs of your business. With the sales module, you can keep track of your clients, contacts, possible clients, and sales opportunities. Dynamics 365 for Sales is the best tool for making sales go better.
With Dynamics 365 for Sales, you can:
 Key Features of Microsoft Dynamics 365 Sales
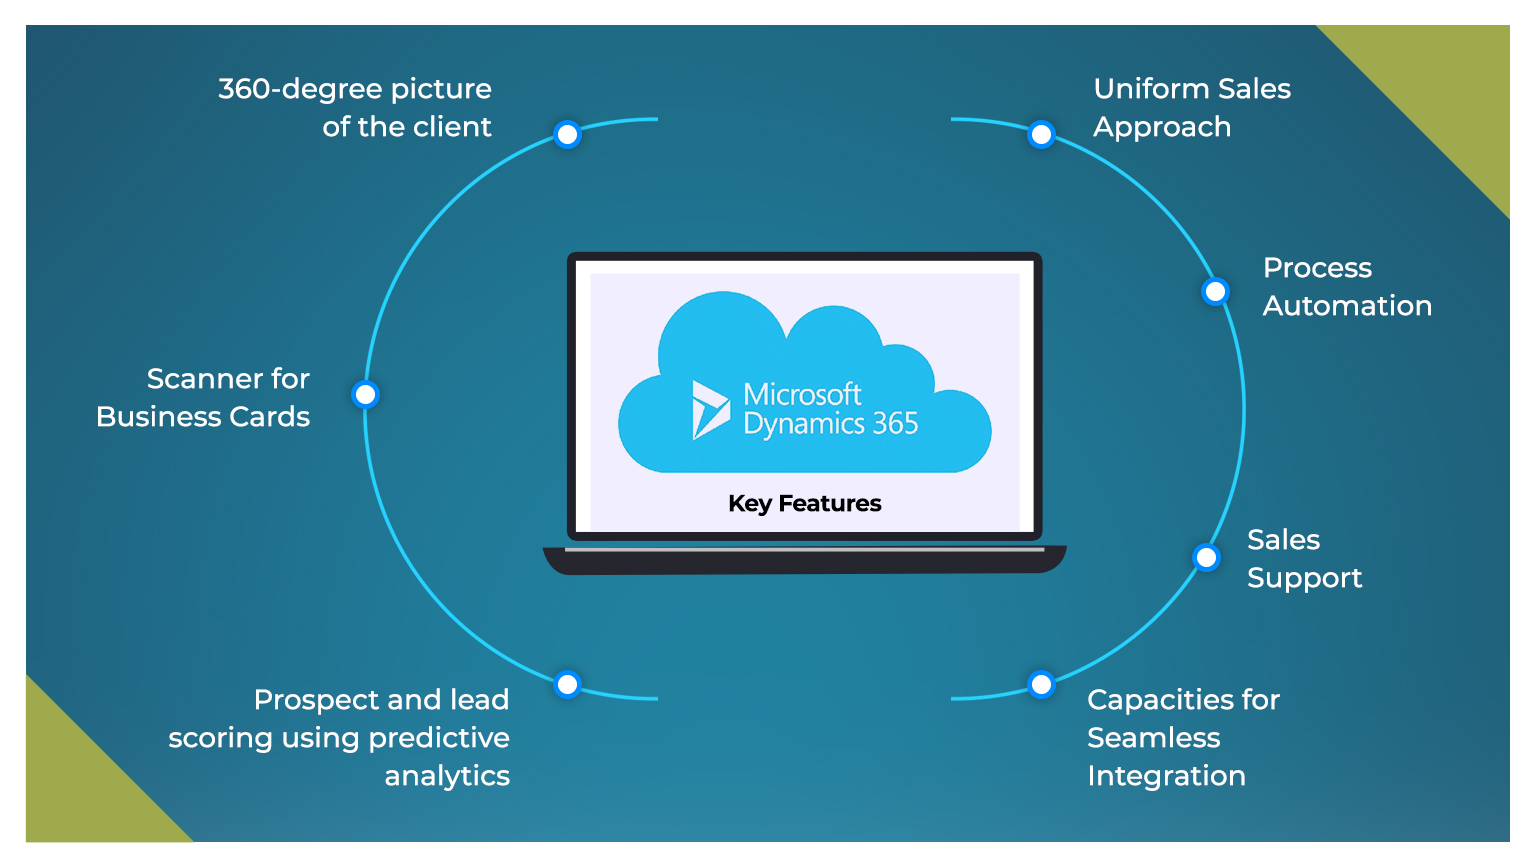
There are various features of Microsoft Dynamics 365 Sales, and these are as follows:
1. A 360-degree view of the customer
This function allows collecting information about clients from when they are prospects until they sign a contract. All touchpoints gather these facts, which can be anything from a person’s name and phone number to information about what they bought. Your sales reps may be more productive if they fully understand their clients from all angles.
2. A uniform way to sell
In Dynamics 365 Sales, you can use playbooks with established sales paths. To ensure your sales process is specialized and consistent, you can make new Playbooks or change the ones you already have to fit your specific customer categories.
3. A machine that reads business cards
With this feature, you can conduct lead data entry automatically. It also lets you look for duplicate contact information and combine it into a single contact, preventing communication mistakes.
4. Automation of the process
Dynamics 365 Sales has a lot of automation options, such as making proposals, quotes, invoices, and more. Personalization is made possible by several automation triggers that use CRM data like names and deal information.
5. Sales Support
With this function, your sales reps can combine and analyze CRM data on client interactions to develop a list of suggested actions for each sales process step. This makes sure that communication is accurate with quick service provision.
6. Using predictive analytics to score prospects and leads
With AI-powered Sales Insights from Dynamics 365 Sales, you can rate the most promising leads and prospects to get a clear picture of how good they are. AI turns both old and new information about clients into scores. With predictive scoring, you can put good leads and prospects at the top of your list, which will help you close more sales.
7. The ability for smooth integration
Dynamics 365 Sales easily connects to other Microsoft tools like Excel, SharePoint, and Power BI. This makes dealing with prospect and opportunity data and analytics easier and helps the sales department build a single source of truth.
Overview of Power BI
Microsoft offers the business analytics service Power BI, which enables you to share insights and display your data. It transforms data from several sources to build dynamic dashboards and Business Intelligence insights.
Key Features of Power BI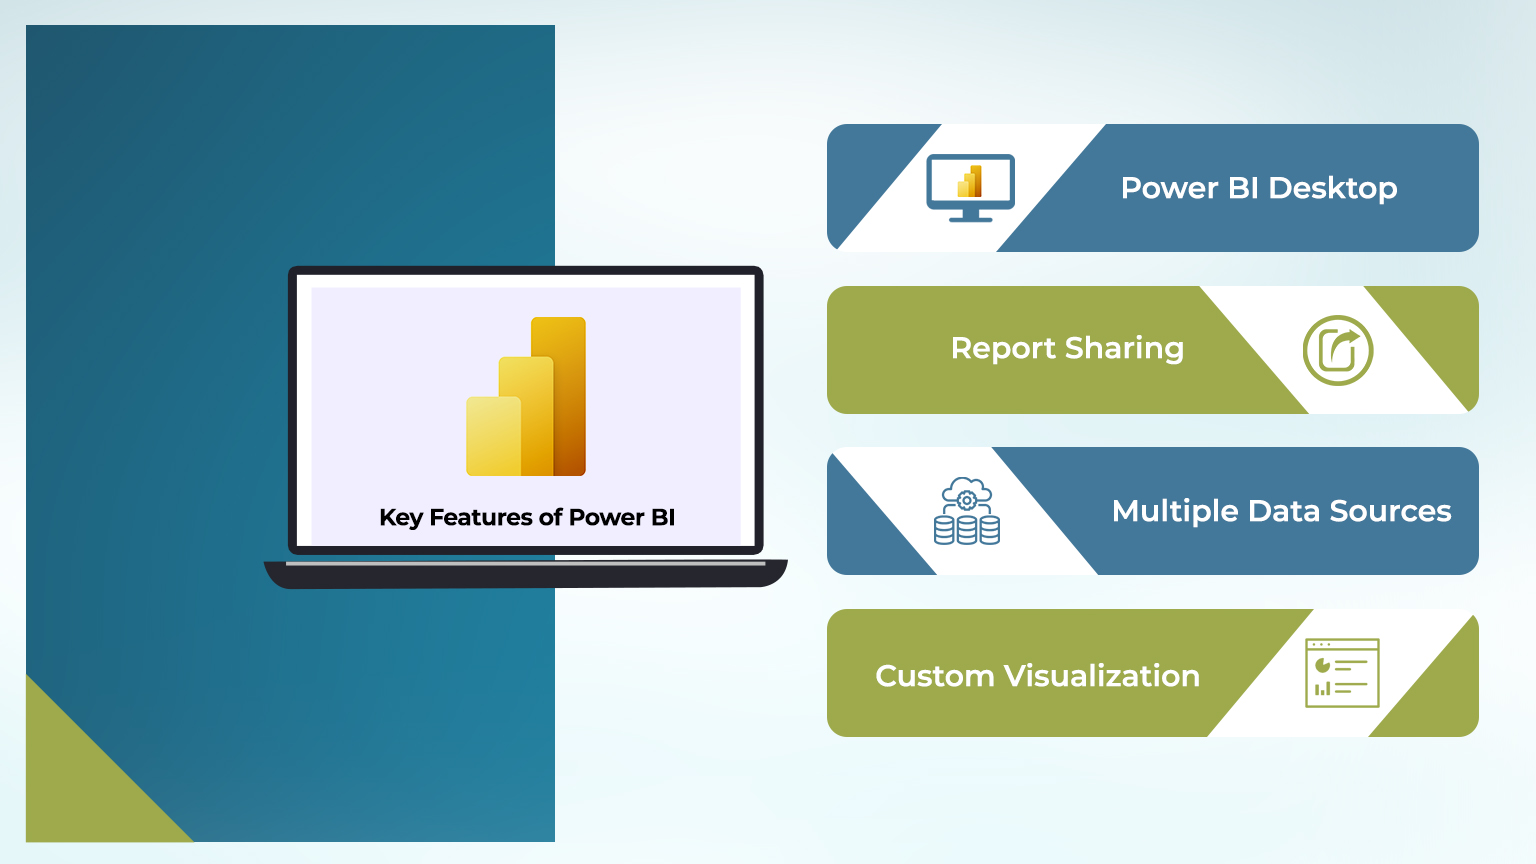
1. Power BI Desktop
Power BI Desktop is a free program you can download and install to make it easy to get data and create reports. Using a Power BI desktop, you don’t need to know much about report design or querying to make a report.
2. Giving out reports
In Power BI, we can share reports with team members without worrying about data security. In Excel, however, sharing reports also means sharing the data sets.
3. Multiple Data Sources
Power BI has 99 or more sources of data. Microsoft has built integrations between SQL, Azure, Excel, Text, CSV, PDF, Cloud, and on-premises data sources. You will see all the data, no matter where it is or how it is stored.
4. Custom Visualization
Power BI comes with a wide range of dashboards and report visualizations already made. In addition to these built-in graphics, you can also download them from marketplaces.
How Dynamics 365 Power BI integration will boost your Organization’s sales.
Microsoft Dynamics 365 gives you several sales dashboards and points of view from which to choose, such as:
1. Sales Goals Metrics
Let’s look at an example to help you see what I mean. Think about a situation in which a company with ten salespeople isn’t making its sales goal in a global sales operation. These sales managers are doing their best to reach their goals. With this dashboard, we can dig deeper into the data and find the countries whose territories aren’t meeting their goals. Say there are only five regional sales reps left. In that case, it will be easier for a sales manager to evaluate each rep’s performance and take the proper steps to close any gaps.
2. Dashboard for Power BI’s sales pipeline
With the Power BI sales pipeline dashboard, it’s easy to look at new opportunities and the different kinds of options, such as:
- Values by kind of customer
- High-growth possibilities by account
You can also look at the opportunities in the pipeline and try to turn them into sales by putting in more work. You can do this by comparing the actual results of your sales team to the goal you set.
3. Power BI’s Trends dashboard
The Power BI trends dashboard is much faster than the standard Dynamics 365 CRM interface. Power BI lets you compare and overlay the performance of two different periods. For example, you could look at your monthly income and see which months did better than the others. Using Power BI, it’s easy to figure out what’s happening. By looking at which leads convert quickly, you can also see if most leads need to be thrown away after a specific time, say five months. You can also figure out why this is happening. This will help you determine where you might miss out on opportunities.
4. Dashboard for Power BI overall sales
With the Power BI sales performance dashboard, you can look at your leads and see how much money you make. So, suppose you see in your sales data that the target profit is slightly lower for a particular time. In that subject, you can look at the dashboard to find the significant differences in sales across different categories and countries.
Five regions, for example, aren’t meeting their goals. You can see which areas are underperforming the most and exceeding their goals.
This lets you focus on the part of the business that is doing the worst and looks for ways to improve it. On the Power BI sales performance dashboards, you can find the answers to these questions with just one click.
Benefits of Microsoft Dynamics 365 Power BI for your Organization
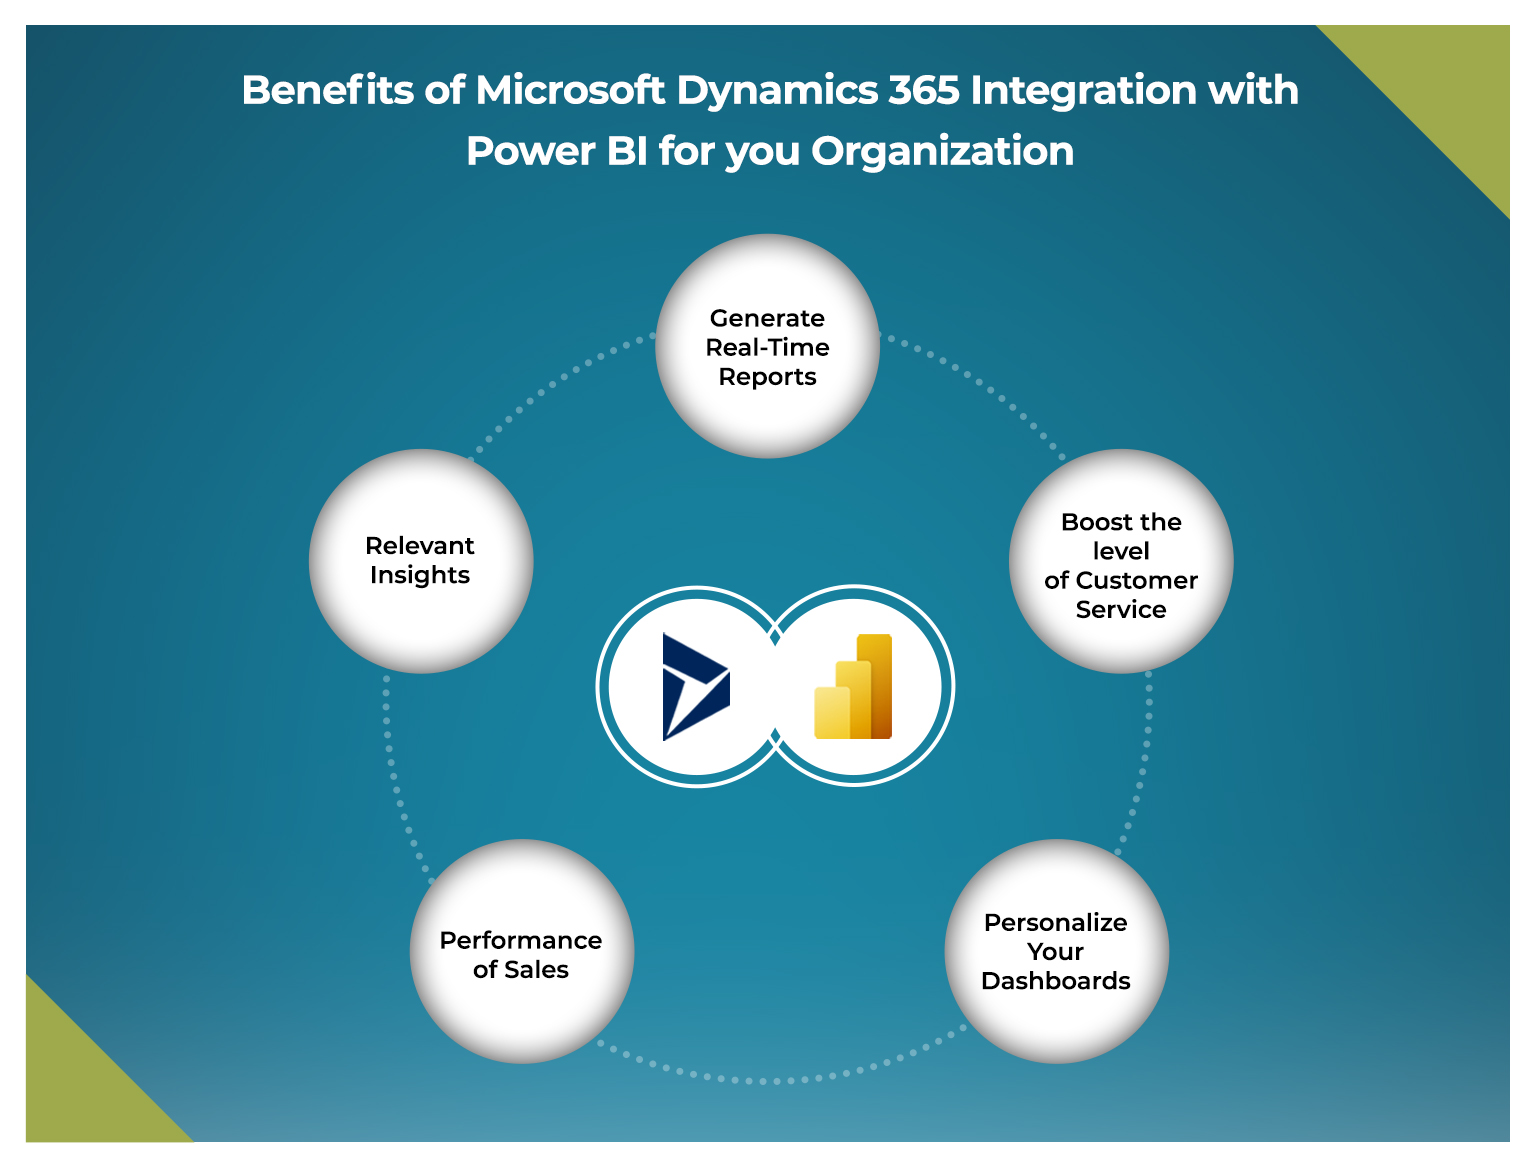 1. Make reports in real time
When you use Power BI and Dynamics 365 together, making reports in real time may be more accessible. This means that the real-time reports these business apps make can be viewed and changed at any time and place.
2. Improve your customer service.
By combining Power BI with Dynamics 365 products, your business can quickly determine what your current and potential customers want and how they feel about your business. Because of this, customer service will eventually get more attention, and it will take less time to answer their questions.
3. Make your dashboards your own
Most companies make the mistake of letting all of their departments use the same dashboard. Collecting data from a single dashboard could lead to misunderstandings, more work, and, most importantly, a stop in the team’s progress. By combining Power BI and Dynamics 365, businesses can give different departments their dashboards that they can use to look at data by just browsing.
4. Relevant Insights
With MS Dynamics 365 and Power BI, you can use predictive intelligence to find and develop good leads. Cross-selling gives you a lot of ways to make more money because you can quickly adapt your suggestions to your clients’ needs. You can interact with customers and get helpful information by looking at customer data in real-time.
5. How well sales went
Using the settings and analytics on the dashboard for sales analytics for the Dynamics 365 app that was made with Power BI, you can set goals, look at the results, and take corrective action as needed. You can manage the pipeline with the help of reports, visualizations, and interactive dashboards. The application’s walkthroughs, videos, and reference materials let you train your sales staff properly.
Integration of Dynamics 365 with Power BI also has a few other advantages:
Look at each department’s different kinds of data to get the specific information you need to make the customer report.
Find out in great detail how your sales have changed over time.
Graphs and charts should be used to present data in a way that makes sense.
Add the sales reports to the Dynamics 365 dashboards and other tools for your CRM.
Conclusion
Integrating the Microsoft Dynamics 365 Sales Module with Power BI should make your sales staff’s work more successful. Using the powerful combination of Power BI and Dynamics 365 CRM makes it easy to get the benefits listed above and quickly boost your sales.
With the help of Power BI and Dynamics 365 CRM, your sales team can become a well-oiled machine that does its job well. It lets your sales team keep track of clients, leads, and prospects, shorten the sales cycle and make more money. Are you ready to use the benefits of Power BI and Dynamics 365 CRM together? Our experts on Dynamics 365 CRM can help you start right away. Call us right away to set up a short meeting.





 Overview of Microsoft Dynamics 365 Sales Module


 1.
1. 