From Data to Insights: A Complete Hack to Tackle Data Discovery
Discovery itself is a word that tells us about the thorough knowledge of any information after researching and analyzing various trends. Same as we find in data discovery, it is simple but a huge term if we dive into it. Data we generally find on the internet or from any source is siloed. The motive of this process is to find valuable insights and correct data from impure and unstructured data. Let’s discuss the topic of data discovery and understand its efficiencies.
What is Data Discovery?
Data discovery is a method of identifying the hidden pattern and trend of gathered data. Data discovery is a transformation process that converts unstructured data to analyzed, processed and visualized data to pluck the information. It doesn’t make any sense to collect more and more data you already have but making use of it by molding it into your business does.
History of Data Discovery
Data discovery is not new to the market it started years ago but the purpose might be different. Data discovery started in 1960 according to the records we have. The modern term, smart data discovery was given by Gartner to describe next-generation data capacities.
In 1960
The statisticians, economists and analysts of the 1960s first referred to the process as data fishing, a negative term that referred to the blind nature of early data mining.
In 1990
The process gained traction in the 1990s when the database community began to rely on data mining and more open-ended forms of data analysis to improve operations.
Now
The explosion of big data came to the next level, followed by AI driven data decisions and machine-learning process automations. Data discovery has now become a must-have in the business process.
Sections of Data Discovery
I have divided the categories of data discovery into three parts. First is data preparation, second is Data visualization and last is Advance analytics and reporting. Let’s dive into it:
Data preparation: This is the elementary level of data discovery. We collect all data, clean, reformate, and merge it from all sources so it can be analyzed consistently, clean, reformate and integrate data from sources it can be analyzed in a consistent form.
Data visualization: Meaning of data visualization here is not about everything pictorial but meaningful. Converting data into a visual format such as a chart graph, bar graph etc. helps the user to comprehend it easily.
Advanced Analytics and Reporting: It involves combining both description and visuals to paint a complete picture of the company’s data.
Types of Data Discovery
Data discovery is divided into two different parts to elaborate it easily
Manual Data Discovery: This approach involves human effort at every step, from collecting data through to its analysis. Humans manually compile, clean, and interpret data, often using tools that require their input for data processing.
Smart Data Discovery: This modern approach pulls AI and machine learning to automate the data discovery process. It provides quick and accurate insights without extensive human intervention, roundup the entire workflow from data collection to result generation.
Benefits of Data Discovery in different Industries
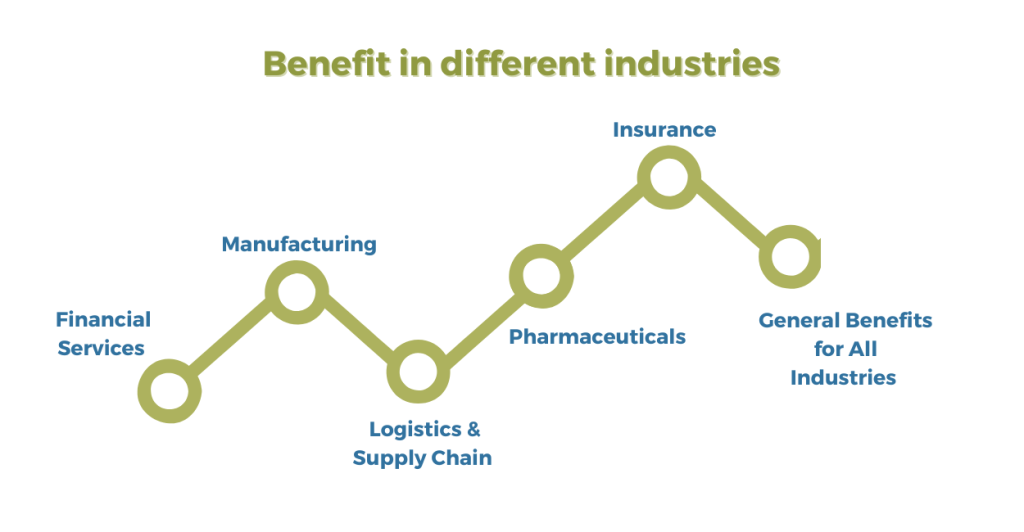 Data Discovery can be beneficial in industries like financial services, manufacturing, pharmaceuticals, logistics and supply chain. After the preface of AI, businesses are booming so far. You can experience limitless advantages of Data Discovery though Beyond Key. Let’s have a look at it:
- Financial Services
Data discovery helps banks in many useful ways. It spots strange transactions pattern and protects the customers from fraud. It also helps in improving credit scoring by providing new insights, reduces risk and allows better loan decisions. Furthermore, by analyzing customer behavior, banks can improve marketing strategies and customize services to better consumer needs.
- Manufacturing
In manufacturing, data discovery secures smooth operations by letting timely fixes of money and time, forecasts machine breakdowns. It enables rapid solutions, enhances quality control by identifying production patterns that lead to errors. Additionally, it improves supply chains by detecting delays and issues with supplier data, shortening material sourcing and delivery.
- Logistics & Supply Chain
In logistics companies, they use data discovery to conserve money and time by modifying delivery routes based on weather, schedules and traffic. It breaks down warehouse management by preventing overstocking or shortage and foresights product demand. Moreover, it helps in reviving partnerships, evaluating vendor performance and insures a stable supply chain.
- Pharmaceuticals
Data discovery reinforces the pharmaceutical industry by rising drug discovery through pattern recognition in biological data. It simplifies clinical trials by optimizing design and patient recruitment. Additionally, it ensures compliance by verifying data across multiple sources to meet legal standards.
- Insurance
Insurance companies use data discovery to assess risks more accurately by analyzing claims and lifestyle data, leading to fairer pricing. It speeds up claims processing by identifying patterns, reducing fraud, and enabling faster approvals. Additionally, it enhances customer retention by revealing preferences, allowing companies to improve services and boost loyalty.
- General Benefits for All Industries
Data discovery helps all industries save costs. For example, it reduces energy waste in manufacturing. In financial services, it makes processes faster and more efficient. In pharmaceuticals, it reduces unnecessary spending on research.
It also improves decision-making everywhere. Companies can use real data instead of guessing. This helps them stay ahead of competitors and grow stronger.
Data Discovery process
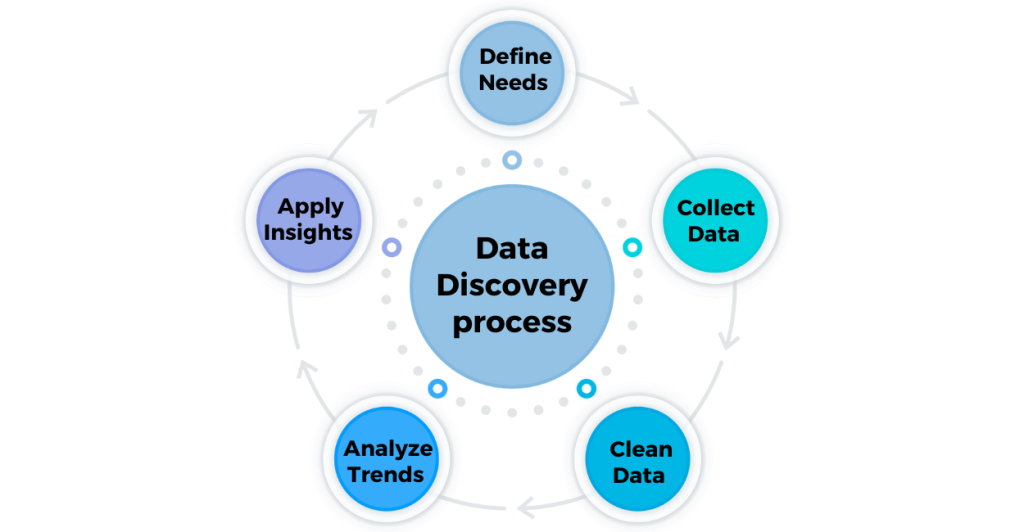 Step 1: Define Needs
Find what your business needs and measure what’s important.
Step 2: Collect Data
Gather data from various sources like files, databases, and APIs.
Step 3: Clean Data
Clean and organize data, removing errors and duplicates.
Step 4: Analyze Trends
Use tools to uncover patterns and trends in your data.
Step 5: Apply Insights
Data scientists analyze trends to deliver insights visually.
Challenges of Data Discovery
The impact of Data Discovery is rapidly increasing; however, challenges are also rising. It’s not just about technology but also affected by the social and economic environment. It can affect the business decision making process. There are some challenges in data discovery. Let’s find it together.
- Although data discovery is upgrading day by day, we still face the issue of quality, inconsistency, and inaccuracy, which lead us to incorrect results.
- Data discovery requires special knowledge and expertise in this domain, and it is tough to find experts in this field. If we got any then they might be expensive. So that can be challenging.
- Another challenge of Data discovery is updated and innovative tools, for better results, but advanced tools can be expensive to install for small industries, and old ones can be a little inaccurate sometimes.
- We also find a lack of governance in data discovery platforms in direction and consistency.
Does Beyond Key offer a Data discovery solution?
Beyond Key’s expertise ensures your organization benefits from ideal data ingestion, integration, real-time analytics, and thorough data visualization and helps to decode new opportunities and multiply business growth.
At Beyond Key, we deliver interactive, visual solutions with the help of data warehousing tools which are Snowflake, MS Fabric and DataBricks to harness data discovery and enhance insights. With the help of tools like PowerBI, Tableau and DOMO, data scientists can easily cross-filter attributes and explore the coordination across multiple databases. Our advanced dashboards display data from different sources without merging tables, saving time and revealing hidden insights. This approach allows us to access faster in approaching innovative and improved decision-making.
Contact us to leverage the full potential of data discovery, optimize your data-driven strategies and stay ahead in the competitive prospect.






 Data Discovery can be beneficial in industries like financial services, manufacturing, pharmaceuticals, logistics and supply chain. After the preface of AI, businesses are booming so far. You can experience limitless advantages of Data Discovery though Beyond Key. Let’s have a look at it:
 Step 1: Define Needs